The pie chart of the structure is very popular for compact design overview or comparison. It is common among users to match small datasets. It is applicable for graphic visualization of any elements of the composition in the total volume of the whole and serves as one of the types of analytical material not only economics.
Online rendering of a pie chart is accompanied by the ability to convert it into the most popular formats PNG, JPEG, PDF, SVG, CSV, XLS and tabular form for further analytical procedures.
Example of calculation using the calculator ’’’
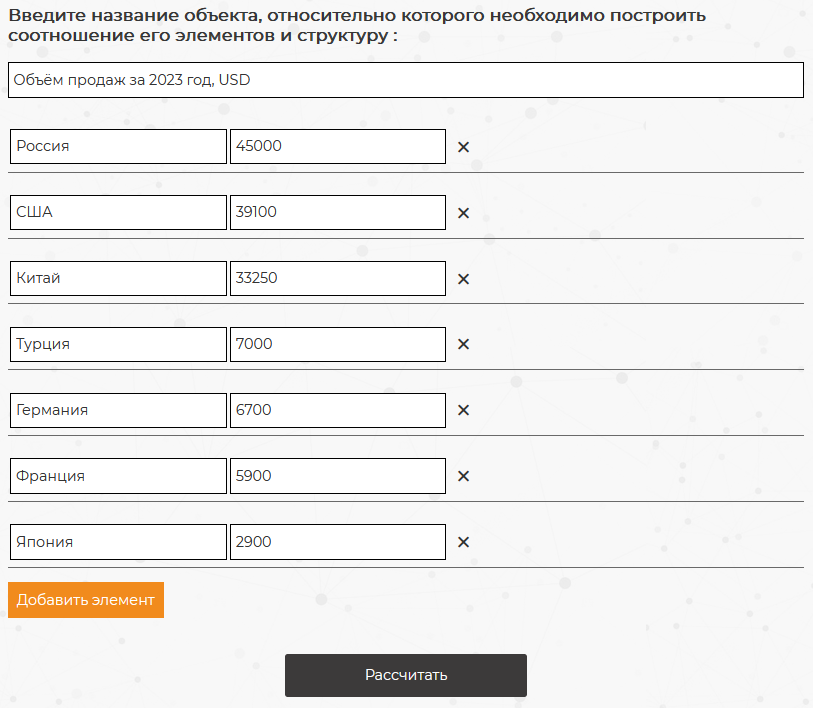
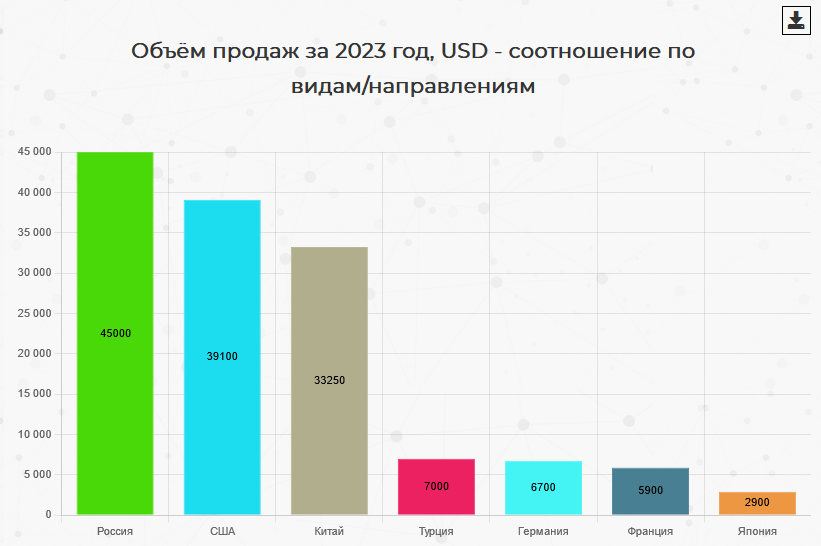
It is necessary to determine the structure of the market for the sale of marketable products (in %) of some company based on the following data on sales volumes by country in value terms (thousand $):
Russia – 45000 thousand.$
USA – 39100 thousand.$
China – 33250 thousand$
Turkey – 7000 thousand.$
Germany - 6700 thousand.$
France – 5900 thousand.$
Japan – 2900 thousand.$
Fill out the form in accordance with the above data and performs the calculation.


